

Image Details
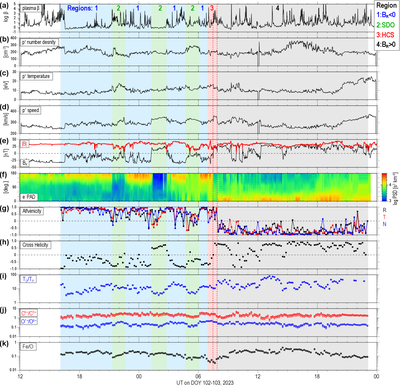
Caption: Figure 2.
A summary of in situ measurements during the HCS crossing of Solar Orbiter from 2023 April 11 to 2022 April 13 by the SWA and MAG instruments. (a) Plasma β based on SWA and MAG. (b)–(d) Proton number density Np, temperature Tp, and velocity Vp as measured by SWA-PAS. (e) Total (∣B∣, red) and radial (Br, black) components of the interplanetary magnetic field (nT) measured by MAG. The dashed line signifies 0 nT. (f) PAD of electrons measured by SWA-EAS. The color scale shows the electron PSD. (g) Alfvénicity evaluated by the correlation coefficient of δB and δV in Radial (R), Tangential (T), and Normal (N) coordinates. The dashed line indicates a correlation coefficient of 0. (h) Cross helicity between B and V. (i) O6+ temperature normalized by the proton temperature reported by PAS (blue). (j) Charge-state ratios for C6+/C5+ (red) and for O7+/O6+ (blue). (k) Fe/O ratio. Three strahl dropouts (SDO) regions are shaded in green while the rest of the Br < 0 region of interest is shaded in blue. The region near the true sector boundary is shaded in red and marked as HCS. The two red dashed lines represent the reversals of cross helicity and Alfvénicity, respectively. The Br > 0 region is shaded in gray.
Other Images in This Article
Copyright and Terms & Conditions
© 2026. The Author(s). Published by the American Astronomical Society.

