

Image Details
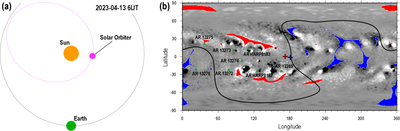
Caption: Figure 1.
(a) Schematic diagram showing locations of the Earth and Solar Orbiter in the solar ecliptic coordinate system during the HCS crossing focused on in this paper. (b) ADAPT magnetogram for the Carrington rotation 2269 with spacecraft footprints and estimated HCS. The coronal holes are also marked with red (blue) for positive (negative) Br. The subspacecraft locations before (blue) and after (red) 6 hr of HCS crossings are marked by the crosses with the magnetic footprints with circles. The expected HCS location is also indicated by the black line. The magnetic footprints are calculated by the magnetic connectivity tool. The green triangles denote locations of active regions identified in CR2269.
Other Images in This Article
Copyright and Terms & Conditions
© 2026. The Author(s). Published by the American Astronomical Society.

