

Image Details
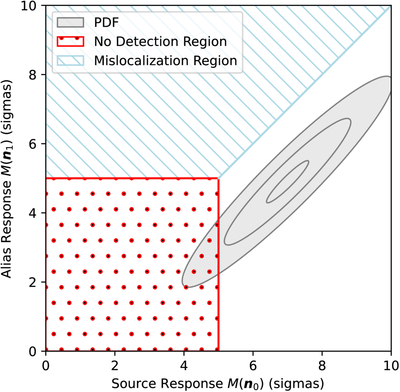
Caption: Figure 12.
An illustration of the 1σ, 3σ, and 5σ contours of the two-dimensional PDF of the matched-filter value of a source and an alias with important regions highlighted. The source has 7σ in brightness, and the alias’s correlation coefficient is 0.7. A detection threshold is shown at 5σ, and the region above the M(u0) = M(u1) line is the case where the alias is brighter than the true source (i.e., the alias mislocalization region). A higher correlation coefficient shifts the center of the PDF closer to this line, but it also makes the contours thinner. For each detected galaxy, a value is drawn from a similar PDF, and unlucky draws will cause the final catalog to lack completeness or reliability.
Other Images in This Article
Show More
Copyright and Terms & Conditions
© 2026. The Author(s). Published by the American Astronomical Society.

