

Image Details
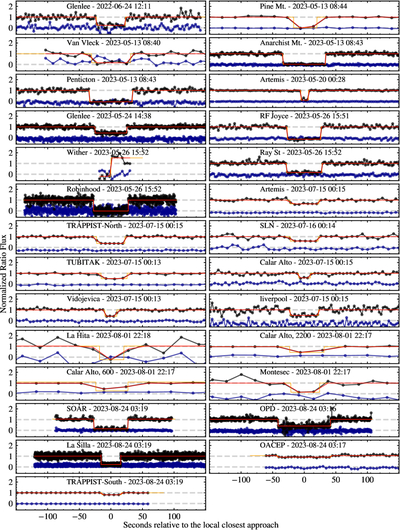
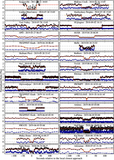
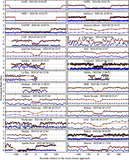
Caption: Figure B2.
Light curves of Quaoar’s occultations that occurred between 2022 and 2023. Black line points represent the normalized target/calibrator flux ratio, while blue line points represent the flux from a star-free region of the sky near the target (ghost). The solid yellow line is the geometric light curve, and the solid red line is the light-curve model.
Other Images in This Article
Copyright and Terms & Conditions
© 2026. The Author(s). Published by the American Astronomical Society.

Copyright ©
2026 Astronomy Image Explorer. All Rights Reserved.
