

Image Details
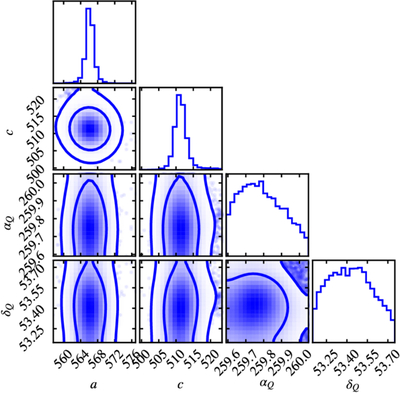
Caption: Figure 1.
Corner plot showing the posterior probability distributions and correlations for the oblate ellipsoid model parameters. The samples used to generate this plot were obtained from an MCMC simulation and filtered to a χ2 below ﹩{\chi }_{\min }^{2}+100﹩. The histograms on the diagonal show the marginal probability distributions for each parameter. The off-diagonal plots show the joint probability distributions for each pair of parameters, revealing their correlations, and the level curves show the 1σ and 3σ regions. The fit is based on all the occultations.
Other Images in This Article
Copyright and Terms & Conditions
© 2026. The Author(s). Published by the American Astronomical Society.

Copyright ©
2026 Astronomy Image Explorer. All Rights Reserved.
