

Image Details
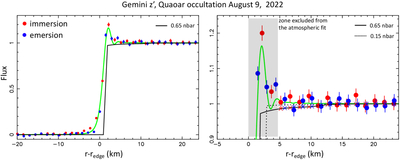
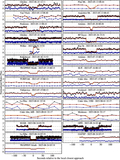
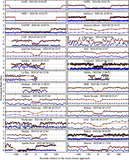
Caption: Figure 3.
Left panel: The immersion (red) and emersion (blue) data points obtained at the Gemini telescope (z’ band) are plotted against their perpendicular distance to the local edge, r − redge, where r is the radial distance to Quaoar’s center, known with a precision of 5.1 km, projected in the sky plane, and redge is the fitted value of each edge radius. The green curve is the best-fitting Fresnel diffraction pattern accounting for the wavelength (λ = 0.947 μm), bandwidth (Δλ = 0.236 μm), stellar diameter (1.33 km), and finite integration time (1.5 km when projected in the sky plane). Although the diffraction model basically captures the presence of the main Fresnel fringe, some disagreement occurs, possibly due to unaccounted properties of the stellar disk profile or local topographic features. This means that in practice the data points within 5 km from the edge are not used in the fit. Also, the ray-tracing program that generates the synthetic curves assumes purely geometric optics, i.e., ignores diffraction effects. The black curve is a synthetic light curve accounting for a CH4 atmosphere with surface pressure psurf = 0.65 nbar, our 3σ upper limit for such an atmosphere. Right panel: enlarged version of the left panel, where the dotted line is a synthetic light curve for a CH4 atmosphere with surface pressure psurf = 0.15 nbar, our 1σ upper limit for an atmosphere. The crosses indicate the points of the model that are used to calculate the χ2 value of the fits.
Other Images in This Article
Copyright and Terms & Conditions
© 2026. The Author(s). Published by the American Astronomical Society.

