

Image Details
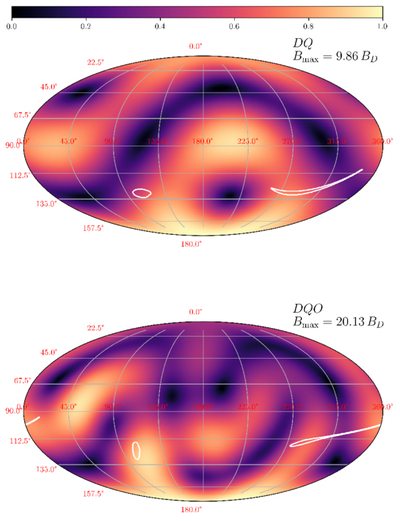
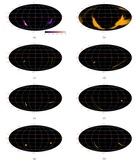
Caption: Figure 11.
Total surface magnetic field for the best-fit solutions, with DQ on top and DQO at the bottom, on a Mollweide projection. The color bar represents normalized value, with 1 being the maximum value on the surface, which is given on top of every subplot as ﹩{B}_{{\rm{\max }}}﹩ (in terms of the dipolar field BD = 1). The contours of the corresponding hotspots are overlaid on top in white.
Other Images in This Article
Show More
Copyright and Terms & Conditions
© 2026. The Author(s). Published by the American Astronomical Society.

Copyright ©
2026 Astronomy Image Explorer. All Rights Reserved.
