

Image Details
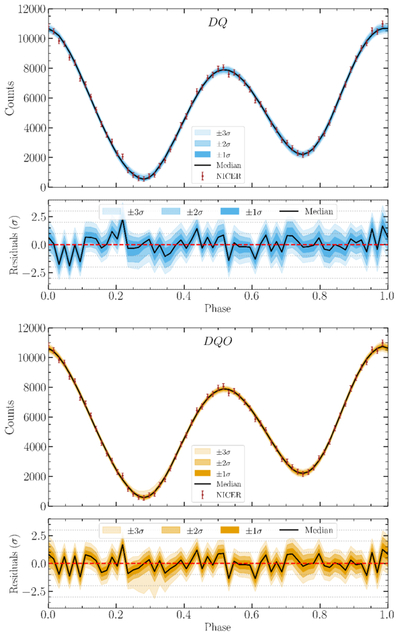
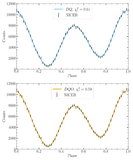
Caption: Figure 5.
Light-curve ensembles for DQ (top, sky blue) and DQO (bottom, orange) configurations are shown with the median in black and the 1σ, 2σ, and 3σ regions shaded from darkest to lightest. The ensembles are generated using the same samples as shown in Figures 3 and 4. NICER data are shown in brown. In the lower panels, residuals are displayed with a red dashed line at 0 for reference.
Other Images in This Article
Show More
Copyright and Terms & Conditions
© 2026. The Author(s). Published by the American Astronomical Society.

Copyright ©
2026 Astronomy Image Explorer. All Rights Reserved.
