

Image Details
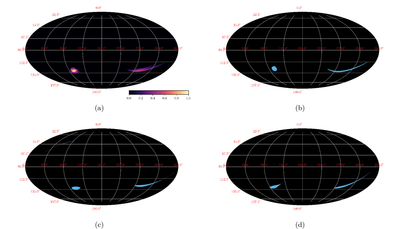
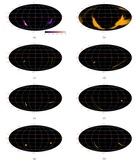
Caption: Figure 6.
Hotspots for the DQ truncation on a Mollweide projection. (a) Ensemble of 105 weighted hotspots, generated using the same samples as shown in Figure 3, with the color bar indicating the transition from low density (black) to high density (yellow–white) regions. Panels (b), (c), and (d) show individual hotspots (sky blue) for three randomly selected cases, illustrating the variety of hotspot configurations.
Other Images in This Article
Show More
Copyright and Terms & Conditions
© 2026. The Author(s). Published by the American Astronomical Society.

Copyright ©
2026 Astronomy Image Explorer. All Rights Reserved.
