

Image Details
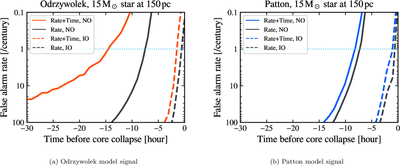
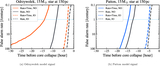
Caption: Figure 3.
Time evolution of expected FAR in KamLAND. (a) and (b) correspond to the Patton and Odrzywolek models, respectively, used as the signal injection models for a 15 M⊙ star at 150 pc. Reference pre-SN light-curve models correspond to 15–25 M⊙ stars at 150 pc assuming the normal mass ordering, as listed in Table 1. The horizontal axis represents the minimized FAR for these reference models, as shown in Equation (6). The horizontal dashed light-blue line represents FAR of 1 century–1.
Other Images in This Article
Copyright and Terms & Conditions
© 2026. The Author(s). Published by the American Astronomical Society.

Copyright ©
2026 Astronomy Image Explorer. All Rights Reserved.
