

Image Details
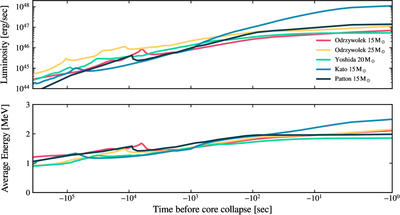
Caption: Figure 1.
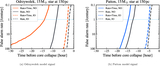
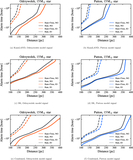
Electron-antineutrino luminosities and their average energy are shown as a function of time before core collapse (horizontal axis). Oxygen- and silicon-shell burning produces peaks around −105 and −104 s before core collapse, respectively. The pre-SN neutrino light-curve models are summarized in Table 1.
Other Images in This Article
Copyright and Terms & Conditions
© 2026. The Author(s). Published by the American Astronomical Society.

Copyright ©
2026 Astronomy Image Explorer. All Rights Reserved.
