Image Details

Choose export citation format:

A SPHEREx Pipeline and Spectral Library for Ultracool Dwarfs

  • Authors: Jonathan Gagné, Jacqueline K. Faherty, Azul Ruiz Diaz, Louis-Philippe Coulombe, Thomas P. Bickle, Adam C. Schneider, J. Davy Kirkpatrick, Marc J. Kuchner, Aaron M. Meisner, Dan Caselden, Adam J. Burgasser, Sarah Casewell, Easton J. Honaker, Frank Kiwy, Federico Marocco, Daniella C. Bardalez Gagliuffi, Nikolaj Stevnbak Andersen, Lizzeth Ruiz Arroyo, Bruce Baller, Paul Beaulieu, John Bell, Martin Bilsing, Troy K. Bohling, Guillaume Colin, Giovanni Colombo, Sam Deen, Alexandru Dereveanco, Kevin Dixon, Hugo A. Durantini Luca, Deiby Flores, Christoph Franck, Christopher Fulvi, Michael Gallmann, Jean Marc Gantier, Konstantin Glebov, Léopold Gramaize, Leslie K. Hamlet, Ken Hinckley, Kevin Jablonski, Peter A. Jałowiczor, Martin Kabatnik, Peter Kasprowitz, K Ly, David W. Martin, Naoufel Marzak, Alexander McColgan, Neil J. McEwan, Marianne N. Michaels, William Pendrill, Stéphane Perlin, Benjamin Pumphrey, James Rabe, Henry Raway, Walter Ruben Robledo, David Roser, Animesh Roy, Arttu Sainio, Vincent Schindler, Manfred Schonau, Jörg Schümann, Karl Selg-Mann, Andrea Serio, Patrick Smith, Andres Stenner, Christopher Tanner, Melina Thévenot, Vinod Thakur, Mayahuel Torres Guerrero, Maurizio Ventura, Nikita V. Voloshin, Jim Walla, Zbigniew Wȩdracki, Bailey Weyandt, Breck Wilhite, Spartacus Zitouni

Jonathan Gagné et al 2026 The Astrophysical Journal 1009 .

  • Provider: AAS Journals

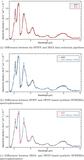
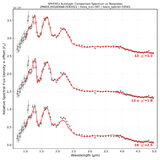
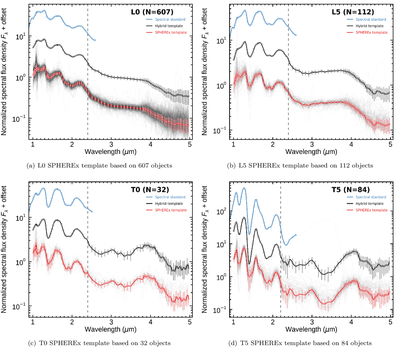
Caption: Figure 5. Hybrid SPHEREx template construction

The complete figure set (47 images) is available in the online journal.

Examples of hybrid SPHEREx template construction. Synthetic spectrophotometry from a known spectral standard is shown in blue (top), and a raw SPHEREx template constructed from the median of all high-quality SPHEREx data with the appropriate spectral type is shown in red (bottom). The hybrid template, constructed by extending the synthetic standard-based spectrophotometry with the raw SPHEREx template beyond 2.4 μm (vertical, dashed line) is shown in black (middle row). For some templates, this limit was moved to 2.1–2.3 μm when the quality of the ground-based data was insufficient in this region. The gray error bars do not represent the error on the mean, but rather the median absolute deviation of all observed SPHEREx spectra to represent visually the typical spread in observed SPHEREx fluxes, which are mostly due to the limited S/N of the spectrophotometry. Splines are shown as solid lines to guide the eye only. See Section 4.2 for more details.

(The data used to create this figure are available in the online article.)

(The data used to create this figure are available.)

Other Images in This Article
Show More

Copyright and Terms & Conditions

Additional terms of reuse