

Image Details
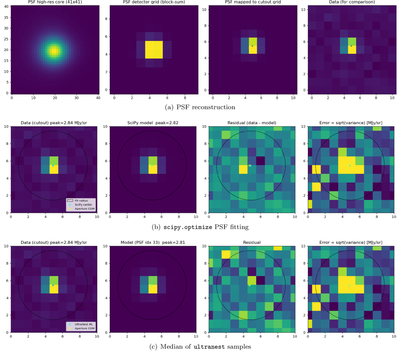
Caption: Figure 1.
Diagnostic figures generated by the SPIFF pipeline. Upper row: PSF reconstruction from the provided oversampled PSF (left column), placed on the detector grid using a box sum (second column), and mapped onto the observed image (third column). A comparison with an observed PSF for SIMP J013656.5+093347.3 is shown in the right column. Middle row: PSF fitting using scipy.optimize. Bottom row: final PSF fitting parameters obtained from the median samples of ultranest. See Section 2 for more details.
Other Images in This Article
Show More
Copyright and Terms & Conditions
© 2026. The Author(s). Published by the American Astronomical Society.

Copyright ©
2026 Astronomy Image Explorer. All Rights Reserved.
