

Image Details
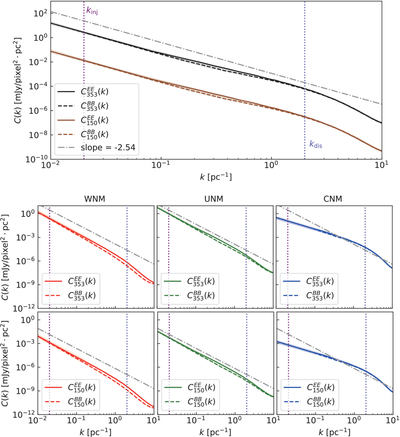
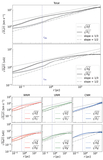
Caption: Figure 6.
E-mode and B-mode power spectra, CEE and CBB, calculated from synthetic dust polarization. Top panel: the power spectra CEE and CBB computed from synthetic dust polarization maps. The gray solid line indicates a reference slope of −2.54, which was the CBB spectral slope measured by Planck at 353 GHz. The subscripts “353” and “150” represent two distinct frequencies: 353 and 150 GHz. kinj is the injection wavenumber of turbulence, and kdis is the numerical dissipation wavenumber. The shaded area represents the standard deviation. Bottom panel: same as the top panel, but for CEE and CBB, calculated from dust polarization in WNM, UNM, and CNM, respectively.
Other Images in This Article
Copyright and Terms & Conditions
© 2026. The Author(s). Published by the American Astronomical Society.

