

Image Details
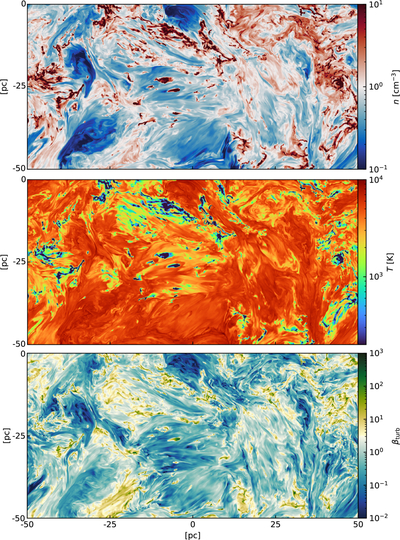
Caption: Figure 1.
Distributions of number density n, temperature T, and turbulent plasma beta βtur in the multiphase ISM simulation. Shown is a two-dimensional slice from the 20483 simulation, displaying the number density (top), temperature (middle), and turbulent plasma beta βtur = ρv2/(B2/8π) (bottom), where ρ is the gas mass density and v is the local turbulent velocity. For visualization purposes, only half of each slice is shown. The CNM, characterized by low temperature, is spatially correlated with the densest regions.
Other Images in This Article
Copyright and Terms & Conditions
© 2026. The Author(s). Published by the American Astronomical Society.

Copyright ©
2026 Astronomy Image Explorer. All Rights Reserved.
