

Image Details
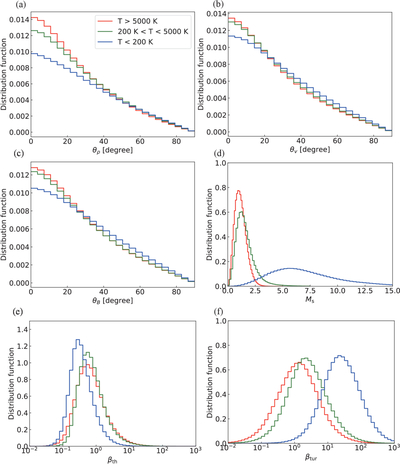
Caption: Figure 2.
(a–c) Distributions of the relative angle θρ, θv, and θB between the local magnetic field and the rotated (by 90∘) density gradient ∇ρ, velocity gradient ∇v, and magnetic field strength gradient ∇B, respectively. The relative angles are evaluated separately for the WNM (T > 5000 K), UNM (200 K <T < 5000 K), and CNM (T < 200 K). Here a relative angle of 0∘ corresponds to parallel alignment, while 90∘ indicates perpendicularity. (d) Distribution of the sonic Mach number Ms = v/cs in each phase. (e) Distribution of the thermal plasma beta, ﹩{\beta }_{{\rm{th}}}=(\rho {c}_{s}^{2}/\gamma )/({B}^{2}/8\pi )﹩. (f) Distribution of the turbulent plasma beta, βtur = ρv2/(B2/8π). All quantities are phase separated based on temperature and computed in three dimensions.
Other Images in This Article
Copyright and Terms & Conditions
© 2026. The Author(s). Published by the American Astronomical Society.

