

Image Details
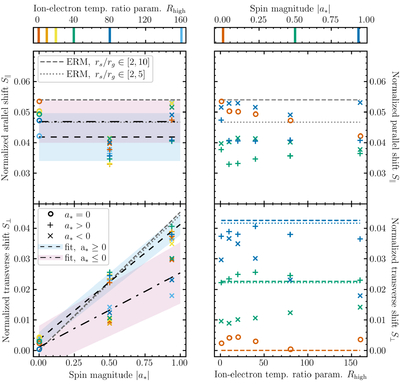
Caption: Figure 4.
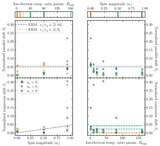
Normalized parallel (top rows) and transverse (bottom rows) shifts in images of MAD GRMHD M87* simulations, viewed at θo = 17∘, as a function of spin (left) and Rhigh (right). Marker style denotes accretion-flow rotation sense. Marker color denotes Rhigh on the left and spin on the right. Best fits of GRMHD models are shown as light blue bands for prograde flows (﹩{\hat{S}}_{\parallel ,+}﹩ Equation (8) and ﹩{\hat{S}}_{\perp ,+}﹩ Equation (11)) and pink bands for retrograde flows (﹩{\hat{S}}_{\parallel ,-}﹩ Equation (9) and ﹩{\hat{S}}_{\perp ,-}﹩ Equation (12)). Best-fit mean values from the equatorial ring model (﹩{\bar{S}}_{\parallel ,{\rm{e}}rm}﹩ Equation (3) and ﹩{\bar{S}}_{\perp ,{\rm{e}}rm}﹩ Equation (4)) are shown as dashed and dotted lines in gray (top left, top right, and bottom left) and spin-dependent colors (bottom right).
Other Images in This Article
Copyright and Terms & Conditions
© 2026. The Author(s). Published by the American Astronomical Society.

