

Image Details
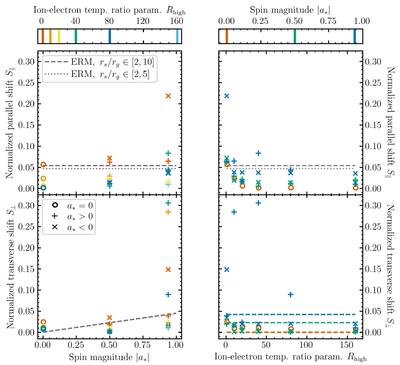
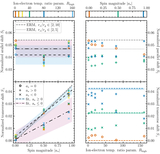
Caption: Figure 7.
Normalized shifts in images of GRMHD SANE simulations viewed at θo = 17∘. The simulation shifts (scattered points) are compared to the best-fit mean shift values of the equatorial ring model (﹩{\bar{S}}_{\parallel ,{\rm{erm}}}﹩ Equation (3) and ﹩{\bar{S}}_{\perp ,{\rm{erm}}}﹩ Equation (4); lines). The coloring, marker style, and line style conventions match those used for the MAD simulations in Figure 4.
Other Images in This Article
Copyright and Terms & Conditions
© 2026. The Author(s). Published by the American Astronomical Society.

Copyright ©
2026 Astronomy Image Explorer. All Rights Reserved.
