

Image Details
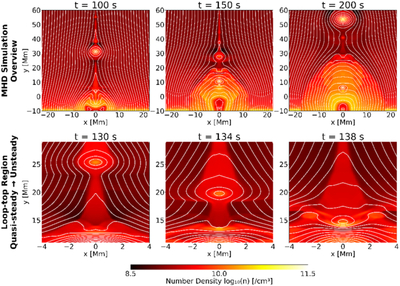
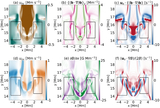
Caption: Figure 1.
Time evolution of the number density distribution in the reconnection region from the MHD simulation. The upper panels show the overall view at t = 100, 150, and 200 s, illustrating the large-scale evolution of the reconnection region. The lower panels show zoomed-in views of the loop-top region at t = 130, 134, and 138 s, highlighting the transition from a quasi-steady state (t = 130 s) to an unsteady state (t = 138 s) caused by a plasmoid collision. White contours represent magnetic field lines.
Other Images in This Article
Copyright and Terms & Conditions
© 2026. The Author(s). Published by the American Astronomical Society.

Copyright ©
2026 Astronomy Image Explorer. All Rights Reserved.
