

Image Details
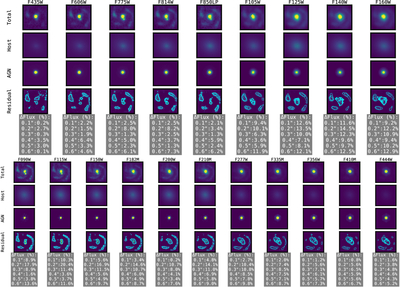
Caption: Figure 10.
AGN–host image decomposition for HST ( top) and NIRCam ( bottom). Each cutout is 1﹩\mathop{.}\limits^{{\unicode{x02033}}}﹩5 × 1﹩\mathop{.}\limits^{{\unicode{x02033}}}﹩5. The first row shows the original image (total), followed by the host and AGN model components in the second and third rows, respectively. The final row displays the residuals, with overlaid contours highlighting the residual structures. All cutouts are shown using the same scale as the original image in each band.
Other Images in This Article
Show More
Copyright and Terms & Conditions
© 2026. The Author(s). Published by the American Astronomical Society.

Copyright ©
2026 Astronomy Image Explorer. All Rights Reserved.
