

Image Details
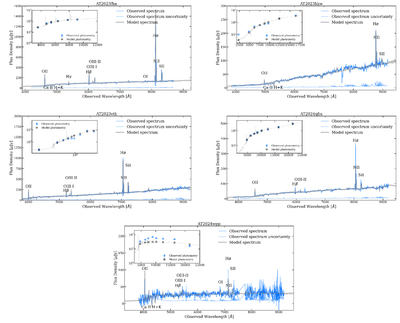
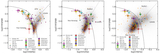
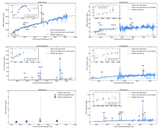
Caption: Figure B1.
The observed photometry (blue circles) and observed spectrum (blue line) compared to the Prospector model photometry (black squares) and spectra (gray lines) for our LFBOT hosts derived at the median of their stellar population property posteriors. We highlight high S/N emission and absorption lines observed in each host spectrum.
Other Images in This Article
Copyright and Terms & Conditions
© 2026. The Author(s). Published by the American Astronomical Society.

Copyright ©
2026 Astronomy Image Explorer. All Rights Reserved.
