

Image Details
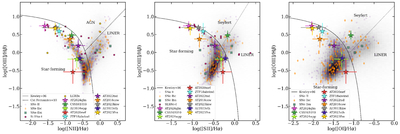
Caption: Figure 5.
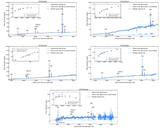
Three variations of the BPT diagram: [O III]/Hβ vs. [N II]/Hα (left), [S II]/Hα (center), [O I]/Hα (right), with the L. J. Kewley et al. (2006) and R. Cid Fernandes et al. (2010) star-forming galaxy-AGN demarcation line overplotted. LFBOT hosts are indicated with stars, SLSNe-I are represented by pink squares, LGRB hosts by yellow pentagons, SNe II hosts with purple circles, SNe Ibc hosts with orange diamonds, and SNe Ibn hosts with green crosses. We also show a field galaxy population from SDSS (gray histogram). In all three BPT diagnostics, LFBOTs appear to lie at higher [O III]/Hβ ratios than the field galaxy population and CCSN hosts, and occur in a more similar phase space as SLSNe-I and LGRB hosts. This is likely caused by increased ionization in the LFBOT, SLSNe-I, and LGRB hosts due to higher amounts of star formation, lower metallicities, and/or a larger massive star population.
Other Images in This Article
Copyright and Terms & Conditions
© 2026. The Author(s). Published by the American Astronomical Society.

