

Image Details
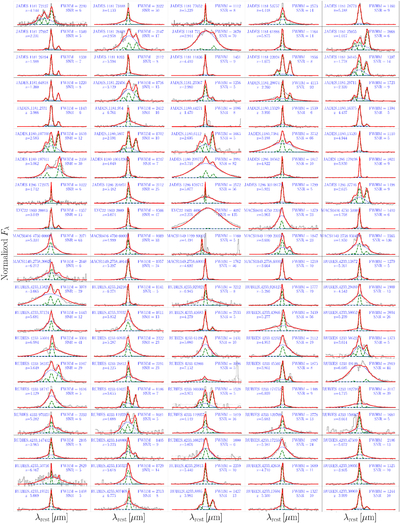
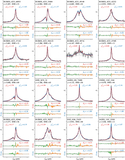
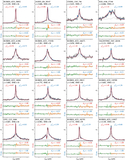
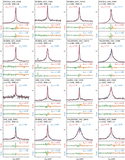
Caption: Figure 8.
JWST NIRSpec spectra for identified BLAGNs. The data and error are shown by the black and gray lines, respectively. Green dashed and blue dotted lines represent the narrow and broad components, respectively. The sum of both components is shown in red. For each galaxy, we also overlay their redshift, Hα broad component’s FWHM (in km s−1), and line signal to noise.
Other Images in This Article
Show More
Copyright and Terms & Conditions
© 2026. The Author(s). Published by the American Astronomical Society.

Copyright ©
2026 Astronomy Image Explorer. All Rights Reserved.
