

Image Details
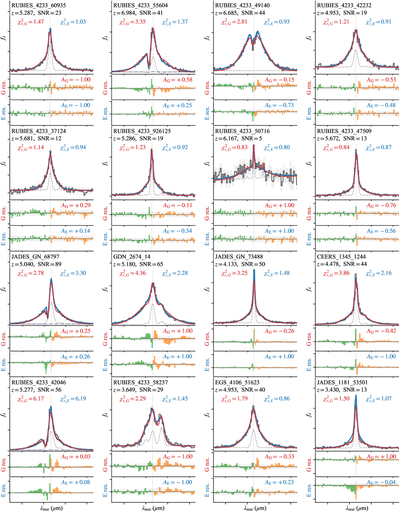
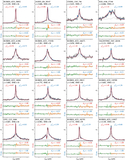
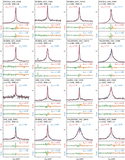
Caption: Figure 7.
Known LRDs from our BLAGN sample. Blue and red lines are the best-fit exponential (V. Rusakov et al. 2026) and Gaussian models, respectively. ﹩{\chi }_{r,G}^{2}﹩ and ﹩{\chi }_{r,E}^{2}﹩ indicate the reduced χ2 of the Gaussian and exponential fits, respectively. AG and AE indicate the broad-line asymmetry, where a value of −1 or +1 indicates blue- or red-wing excess, respectively. The residuals are shown in the bottom panels, with the left and right wings indicated in green and orange, respectively. Overall, exponential models fit the line profiles better.
Other Images in This Article
Show More
Copyright and Terms & Conditions
© 2026. The Author(s). Published by the American Astronomical Society.

Copyright ©
2026 Astronomy Image Explorer. All Rights Reserved.
