

Image Details
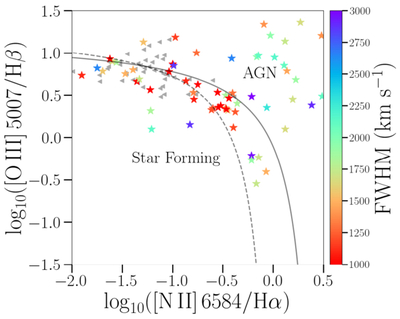
Caption: Figure 6.
BPT diagram of our sample of BLAGNs. ⋆ show points from our study and ▸ represents galaxies z > 4 found by K. Nakajima et al. (2023). The black solid and dashed curves show the limits between AGNs and star-forming galaxies as found by L. J. Kewley et al. (2001) and G. Kauffmann et al. (2003).
Other Images in This Article
Show More
Copyright and Terms & Conditions
© 2026. The Author(s). Published by the American Astronomical Society.

Copyright ©
2026 Astronomy Image Explorer. All Rights Reserved.
