Image Details
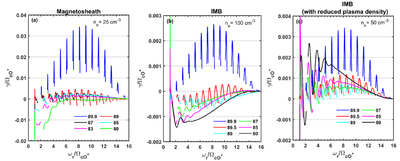
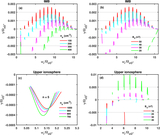
Caption: Figure 3.
Normalized growth rate of O+ cyclotron harmonics plotted against normalized real frequency for different wave propagation angles, as indicated in the legends. Panels (a) and (b), show results for the magnetosheath (25 cm−3) and the IMB region (100 cm−3), respectively, while panel (c) shows the results for the IMB region with reduced plasma density (50 cm−3).
Other Images in This Article
Copyright and Terms & Conditions
© 2026. The Author(s). Published by the American Astronomical Society.
Copyright ©
2026 Astronomy Image Explorer. All Rights Reserved.