Image Details
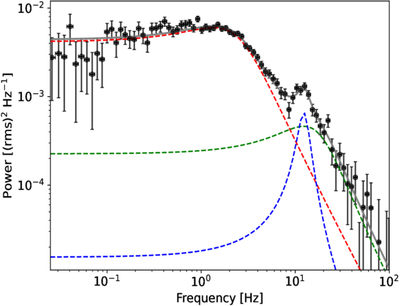
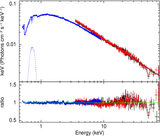
Caption: Figure 3.
PDS (black) of EP250916a using XMM-Newton. The gray line shows the best-fit model with three Lorentzian components. Broad Lorentzians (red and green) describe the underlying noise, while the narrow Lorentzian (blue) indicates a weak QPO at ≈13 Hz.
Other Images in This Article
Copyright and Terms & Conditions
© 2026. The Author(s). Published by the American Astronomical Society.
Copyright ©
2026 Astronomy Image Explorer. All Rights Reserved.