Image Details
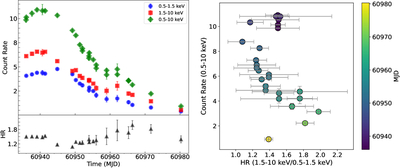
Caption: Figure 2.
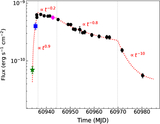
Left: Swift/XRT light curves of EP250916a in the 0.5–1.5 keV (soft; blue circles), 1.5–10 keV (hard; red squares), and 0.5–10 keV (full; green diamonds) bands (top), with the corresponding hardness ratio (HR = 1.5–10 keV/0.5–1.5 keV) shown below. Each point represents a single Swift/XRT observation. Right: hardness–intensity diagram illustrating the spectral evolution of EP250916a during the outburst, color coded by time (MJD).
Other Images in This Article
Copyright and Terms & Conditions
© 2026. The Author(s). Published by the American Astronomical Society.
Copyright ©
2026 Astronomy Image Explorer. All Rights Reserved.