Image Details
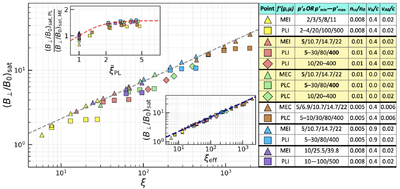
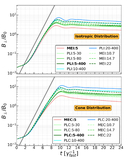
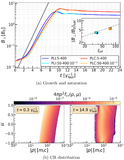
Caption: Figure 5.
The saturated magnetic field ﹩{\left({B}_{\perp }/{B}_{0}\right)}_{{\rm{sat}}}﹩ vs. the anisotropy parameter ξ. The shapes and colors represent different simulations (see the table on the right; see Table 2 for the nomenclature of the runs). Momenta separated by “/” represent different runs (e.g., PLI:5-30/80 implies PLI:5-30 and PLI:5-80). For the points with the same colors and shapes, larger ξ’s correspond to larger momenta (e.g., for PLI:5-30/80, ξ for PLI:5-80 is larger than PLI:5-30). The gray dashed line represents the prediction, i.e., Equation (15). The runs with monenergetic CRs mostly follow this prediction, unlike those with power-law CRs. Upper inset: modeling of ﹩{\left({B}_{\perp }/{B}_{0}\right)}_{{\rm{sat}}}﹩ using Equation (18) (red dashed line). Lower inset: modeling of ﹩{\left({B}_{\perp }/{B}_{0}\right)}_{{\rm{sat}}}﹩ using Equation (17) (navy-blue dashed line).
Other Images in This Article
Show More
Copyright and Terms & Conditions
© 2026. The Author(s). Published by the American Astronomical Society.