

Image Details
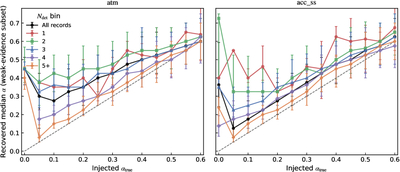
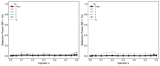
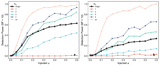
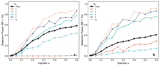
Caption: Figure 6.
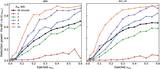
Calibration of mixing-fraction recovery with explicit ﹩{N}_{{\rm{\det }}}﹩ stratification. Comparison of injected vs. recovered Ca-normalized mixing fractions (α) for synthetic records passing the weak-evidence threshold ﹩\mathrm{ln}{\rm{BF}}\gt 1﹩. Curves show the median recovered slab-posterior median α in bins of ﹩{N}_{{\rm{\det }}}﹩; error bars denote the interquartile range across retained simulations. (a) Photospheric track (atm). (b) Diffusion-adjusted track (acc_ss). The dashed line indicates perfect recovery.
Other Images in This Article
Copyright and Terms & Conditions
© 2026. The Author(s). Published by the American Astronomical Society.

Copyright ©
2026 Astronomy Image Explorer. All Rights Reserved.
