

Image Details
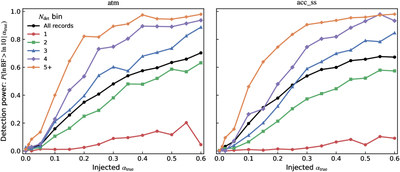
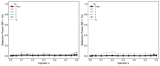
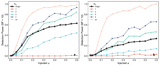
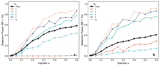
Caption: Figure 5.
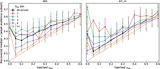
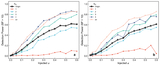
Injection–recovery detection power is dominated by element richness. Strong-evidence detection power, i.e., ﹩P(\mathrm{ln}{\rm{BF}}\gt \mathrm{ln}10| {\alpha }_{{\rm{true}}})﹩, is plotted against the injected Ca-normalized mixing fraction αtrue. Curves show recovery for all records together and after stratifying by the number of detected elements ﹩{N}_{{\rm{\det }}}﹩. (a), Photospheric track (atm). (b), Diffusion-adjusted track (acc_ss).
Other Images in This Article
Copyright and Terms & Conditions
© 2026. The Author(s). Published by the American Astronomical Society.

Copyright ©
2026 Astronomy Image Explorer. All Rights Reserved.
