Image Details
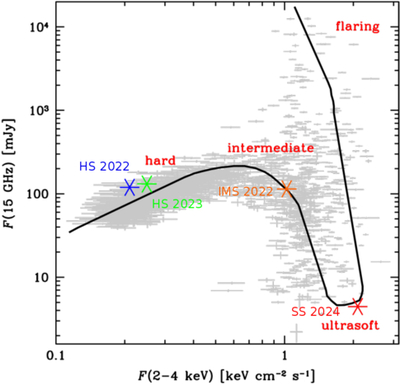
Caption: Figure 6.
X-ray versus radio flux density diagram. Blue, orange, green, and red asterisks indicate the IXPE observations HS 2022, IMS 2022, HS 2023, and SS 2024, respectively. Gray points represent data from AMI and were presented in A. A. Zdziarski et al. (2016).
Other Images in This Article
Copyright and Terms & Conditions
© 2026. The Author(s). Published by the American Astronomical Society.
Copyright ©
2026 Astronomy Image Explorer. All Rights Reserved.