Image Details
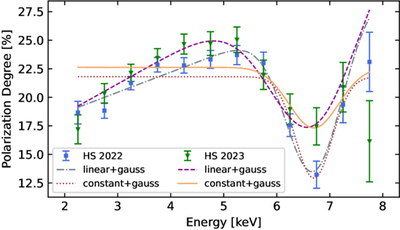
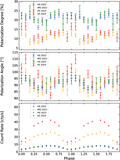
Caption: Figure 4.
IXPE PDs (data points, HS 2022 in blue and HS 2023 in green) with two PD models fitted to the data of the two epochs: a linear change of the PD with energy plus a nonpolarized Gaussian is shown with the dashed–dotted gray line (HS 2022) and the dashed purple line (HS 2023). A constant PD model with a nonpolarized Gaussian is shown with the dotted brown line (HS 2022) and the solid orange line (HS 2023).
Other Images in This Article
Copyright and Terms & Conditions
© 2026. The Author(s). Published by the American Astronomical Society.
Copyright ©
2026 Astronomy Image Explorer. All Rights Reserved.