Image Details
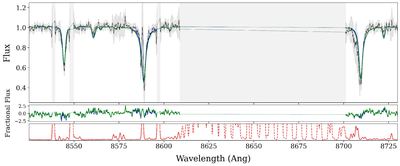
Caption: Figure 2.
The extracted 1D spectrum of DF9 (black), with two fit templates, each with ages and metallicities taken from the central results of past literature (J. S. Gannon et al. 2023 in green; Y. Tang et al. 2025 in blue), overplotted. The flux is given in units relative to the continuum, and regions with strong sky-line residuals have been masked (dashed lines), with the sky spectrum (red) and residual flux as a fraction of the measurement uncertainty plotted in the bottom panels.
Other Images in This Article
Copyright and Terms & Conditions
© 2026. The Author(s). Published by the American Astronomical Society.
Copyright ©
2026 Astronomy Image Explorer. All Rights Reserved.