Image Details
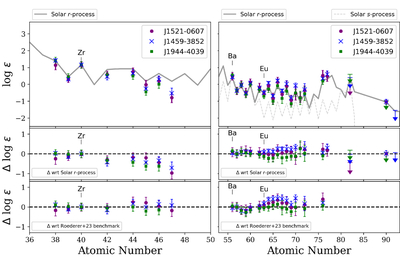
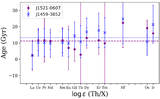
Caption: Figure 4.
Abundance patterns of the three target stars with respect to (wrt) to various benchmark patterns for the light r-process elements (Z ≤ 47; left) and the heavy r-process elements (Z ≥ 56; right). The light r-process patterns are scaled to the same Zr abundance, while the heavy r-process patterns are scaled to the same La abundance. The top panels show the full r-process abundance patterns of the three target stars compared to the solar s- and r-process patterns from C. Arlandini et al. (1999), while the middle panel shows the residual offsets from the solar r-process pattern. The bottom panel shows the offsets relative to the metal-poor star benchmark pattern from I. U. Roederer et al. (2023). The uncertainties in ﹩{\rm{\Delta }}\mathrm{log}\epsilon ({\rm{X}})﹩ reflect uncertainties from this paper and the benchmark values, added in quadrature.
Other Images in This Article
Copyright and Terms & Conditions
© 2026. The Author(s). Published by the American Astronomical Society.