Image Details
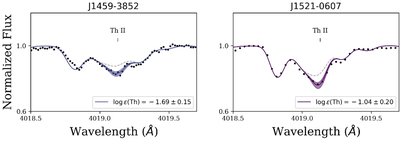
Caption: Figure 2.
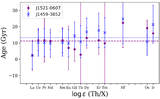
Example syntheses of the Th II line in J1459−3852 (left) and J1521−0607 (right). The black points show the spectrum, the solid lines show the best-fit syntheses, and the shaded regions show abundance uncertainties. The dashed gray lines show the synthesis with zero abundance for the line of interest.
Other Images in This Article
Copyright and Terms & Conditions
© 2026. The Author(s). Published by the American Astronomical Society.
Copyright ©
2026 Astronomy Image Explorer. All Rights Reserved.