Image Details
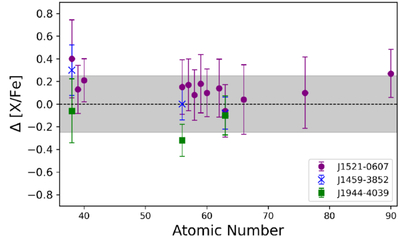
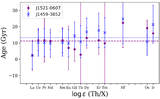
Caption: Figure 3.
Differences between abundances measured in this portrait analysis compared to the snapshot analyses from the literature (C. M. Sakari et al. 2018a for J1521−0607; E. M. Holmbeck et al. 2020 for J1459−3852 and J1944−4039). The dashed horizontal line shows equal agreement, while the light gray band shows offsets of ±0.25 dex.
Other Images in This Article
Copyright and Terms & Conditions
© 2026. The Author(s). Published by the American Astronomical Society.
Copyright ©
2026 Astronomy Image Explorer. All Rights Reserved.