Image Details
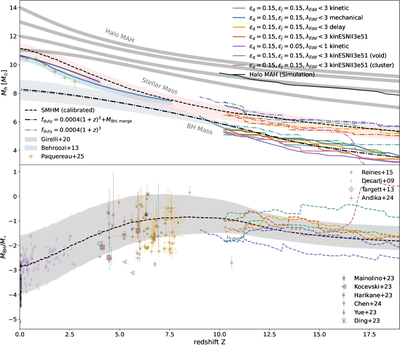
Caption: Figure 4.
Top: overview of the self-consistent model. The halo assembly history from TNG is shown as the gray shaded curve, while the simulated halo mass evolution is plotted as the solid black line, reaching Mhalo = 1012 M⊙ at z = 0. Analytical stellar mass growth using the TNG-calibrated SMHM relation is shown as a red shaded region, representing the uncertainty in the stellar mass normalization arising from both observational systematics and variations among SN feedback prescriptions. Stellar mass evolution from the individual feedback simulations is shown as colored dashed–dotted lines. Independent stellar mass estimates from G. Girelli et al. (2020, purple shaded region), P. S. Behroozi et al. (2013, blue shaded region), and L. Paquereau et al. (2025, yellow circles) are also included. The BH mass growth predicted by the observationally calibrated duty-cycle model is shown as the solid black curve, with the dark blue shaded region indicating the propagated 1σ uncertainty associated with the duty-cycle normalization. Contributions from BH mergers are shown as a black dashed–dotted curve, while BH masses from the simulations are plotted as colored dashed–dotted lines. Bottom: evolution of the MBH/M⋆ ratio for the feedback simulations (colored dashed curves) compared with the prediction from the self-consistent analytical model (black dashed curve). The gray shaded region denotes the propagated 1σ uncertainty in the mass ratio, combining uncertainties in both BH growth and stellar mass normalization. From the peak to z = 0, the ratio decreases by roughly 2 orders of magnitude, exhibiting a broad peak at z ∼ 7–10 and declining toward both higher and lower redshifts. The model also predicts that the mass ratio is higher than its z = 0 value by factors of approximately 1.5, 3.0, 8.0, and 35.5 at z = 1, 2, 3, and 5, respectively.
Other Images in This Article
Copyright and Terms & Conditions
© 2026. The Author(s). Published by the American Astronomical Society.