Image Details
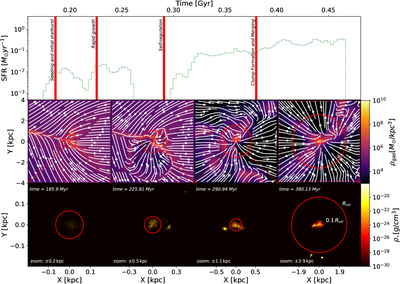
Caption: Figure 3.
Star formation history (top) and snapshots from the AGN + kinetic SN feedback simulation with ﹩{E}_{{\rm{SN}}}=1{0}^{51}\,{\rm{erg}}﹩. Vertical red lines mark four epochs (t = 185.90, 225.81, 290.94, and 380.13 Myr) corresponding to distinct phases of BH–galaxy coevolution. Middle panels show 8 kpc slices of projected gas density with velocity streamlines. Bottom panels show zoomed-in stellar density maps of the central region. Dashed boxes indicate the zoomed regions, with connecting lines linking the panels. The zoom scale varies between snapshots (as labeled) to highlight central structure and, in the final panel, outer stellar clumps. Red circles denote Rvir and 0.1 Rvir.
Other Images in This Article
Copyright and Terms & Conditions
© 2026. The Author(s). Published by the American Astronomical Society.