

Image Details
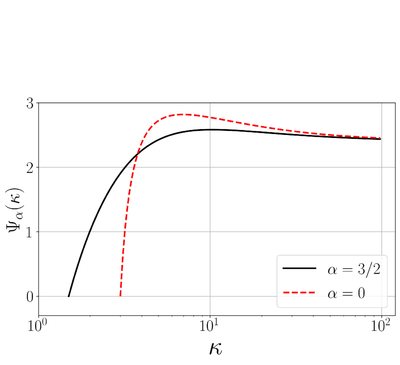
Caption: Figure 3.
Comparative plot of the Ψα factor, for two different values of α. The dashed curve in red is for α = 0, and the solid black line is for α = 3/2. We can observe, independent of the value of α, how the Ψα function saturates quickly for high values of κ.
Other Images in This Article
Copyright and Terms & Conditions
© 2026. The Author(s). Published by the American Astronomical Society.

Copyright ©
2026 Astronomy Image Explorer. All Rights Reserved.
