

Image Details
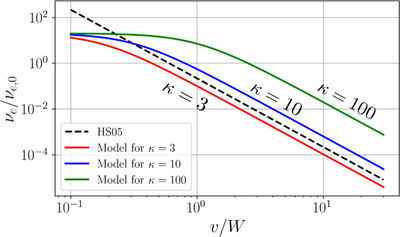
Caption: Figure 2.
Comparison of collision frequency νe(v) function curves. The dashed black curve represents the collision frequency described by the Helander and Sigmar model, which exhibits a velocity-dependent collision frequency following a power law. On the other hand, the red curve represents the collision-frequency model proposed in Equation (11) for α = 0. In our model, νe converges to a finite value as velocity tends to 0, and also for large values of κ. At the same time, it decreases according to a power law, at the same rate as HS05, for sufficiently high velocities.
Other Images in This Article
Copyright and Terms & Conditions
© 2026. The Author(s). Published by the American Astronomical Society.

Copyright ©
2026 Astronomy Image Explorer. All Rights Reserved.
