

Image Details
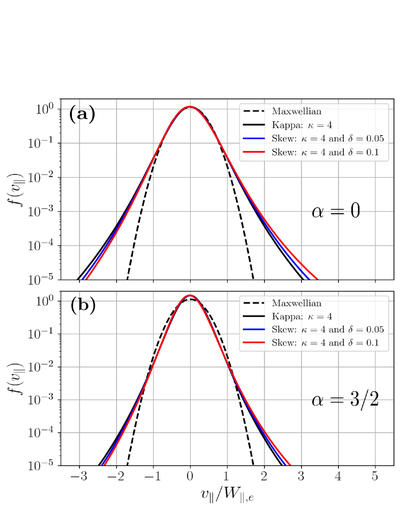
Caption: Figure 1.
Comparative plot of different types of distribution functions. In the top and bottom panels, the dashed black curves represent a Maxwellian distribution that decays much faster than the other functions. The solid black lines correspond to a Kappa distribution with κ = 4. In contrast, the blue and red curves represent skew–Kappa distributions, both with κ = 4 and a skewness parameter δ = 0.05 and δ = 0.1, respectively. In panel (a) are plotted Kappa and skew–Kappa distributions with α = 0. In panel (b), they are plotted for α = 3/2.
Other Images in This Article
Copyright and Terms & Conditions
© 2026. The Author(s). Published by the American Astronomical Society.

Copyright ©
2026 Astronomy Image Explorer. All Rights Reserved.
