Image Details
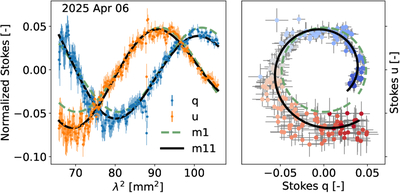
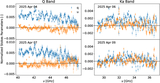
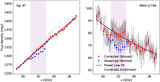
Caption: Figure 3.
Normalized Stokes q and u parameters of MAXI J1744 on the 2025 April 6 epoch compared with the best-fit m1 (dashed light green lines; single component) and m11 (solid black lines; double component) models. Appendix D gives more details about the models. Left: Stokes q and u spectra. Right: Stokes q vs. u plot. The data point colors correspond to the observing frequency, matching the color scheme in Figure 1.
Other Images in This Article
Copyright and Terms & Conditions
© 2026. The Author(s). Published by the American Astronomical Society.
Copyright ©
2026 Astronomy Image Explorer. All Rights Reserved.