Image Details
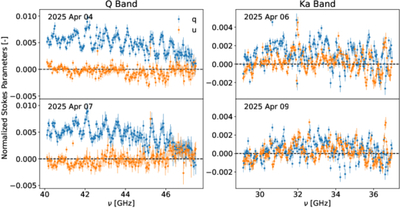
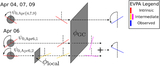
Caption: Figure 5.
Normalized Stokes parameter spectropolarimetry of Sgr A* for all four observations. Blue and orange show q and u, respectively, as a function of observing frequency. Each panel shows one night’s results as labeled.
Other Images in This Article
Copyright and Terms & Conditions
© 2026. The Author(s). Published by the American Astronomical Society.
Copyright ©
2026 Astronomy Image Explorer. All Rights Reserved.