Image Details
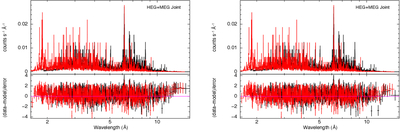
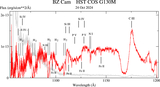
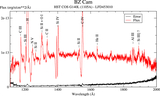
Caption: Figure 2.
Fits to the joint HETG, HEG, and MEG spectra of BZ Cam. HETG spectra are fit simultaneously with the model, tbabs ×zxipcf×(VNEI+power) on the left and tbabs ×pcfabs×zxipcf×(VNEI) model on the right. The residuals of the fits are displayed in the lower panels in standard deviations (in sigmas).
Other Images in This Article
Copyright and Terms & Conditions
© 2026. The Author(s). Published by the American Astronomical Society.
Copyright ©
2026 Astronomy Image Explorer. All Rights Reserved.