Image Details
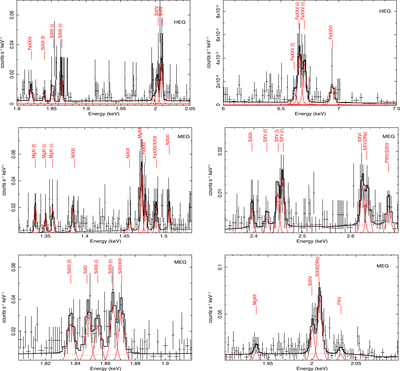
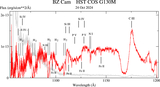
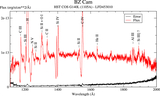
Caption: Figure 1.
The top-left and right-hand panels show selected identified and fitted lines for the HEG spectrum of BZ Cam, labeled individually (silicon and iron lines). Lines are fit with a GAUSS emission line model, and the results are listed in Table 1. The middle and bottom panels are of MEG spectra. The middle row displays selected, identified, and fitted lines of H-like and He-like Magnesium (on the left) and H-like and He-like sulfur lines, along with some other detected lines (on the right). The bottom panels show the silicon line complex between 1.8 and 2.1 keV. Lines are fit with a GAUSS emission line model, and the results are listed in Table 2.
Other Images in This Article
Copyright and Terms & Conditions
© 2026. The Author(s). Published by the American Astronomical Society.