Image Details
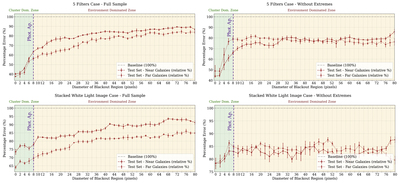
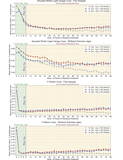
Caption: Figure 7.
Occlusion experiments with inner-cluster masking, analogous to Figure 3, but separately for the nearest (IC 5332, NGC 0628c, NGC 3351, NGC 3627) and most distant (NGC 1566, NGC 1433, NGC 7496, NGC 1512, NGC 1365) galaxy samples. The top row shows results for the five-filter inputs, and the bottom row for the stacked white-light images. The left panels use the full dataset, while the right panels exclude extreme-age clusters. The x-axis gives the blackout diameter (in pixels), and the y-axis shows the relative percentage error. This metric is computed by dividing the scatter (dex) from each blackout configuration by the scatter of the corresponding fixed guess baseline (mean cluster age of the training set), then expressing it as a percentage. The dashed black line marks the 100
Other Images in This Article
Copyright and Terms & Conditions
© 2026. The Author(s). Published by the American Astronomical Society.