Image Details
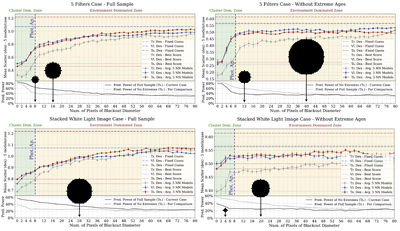
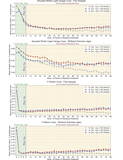
Caption: Figure 3.
Blackout experiments to assess the spatial localization of age-predictive information in image cutouts centered on star clusters. A circular mask of increasing diameter is applied concentrically over each image, progressively removing central and surrounding regions. The x-axis shows the blackout diameter (in pixels), while the y-axis reports the mean scatter (dex) of five independently trained models for training (Tr.), validation (Vl.), and test (Ts.) datasets. The top row corresponds to the five-filter HST input, and the bottom row to the stacked single white-light image. Left panels use the full cluster sample, while right panels exclude extreme-age systems. Dashed horizontal lines at the top of each panel indicate the fixed guess baseline (nonlearned average prediction). The black silhouettes illustrate representative blackout masks at different diameters. The different color regions mark the transition from cluster-dominated zones (green) to environment-dominated zones (orange). The black curve at the bottom of each panel quantifies the relative predictive power retained in the visible pixels, computed ﹩({{\rm{baseline}}}_{{\rm{test}}}^{2}-{{\rm{curve}}}_{{\rm{test}}}^{2})/{{\rm{baseline}}}_{{\rm{test}}}^{2}﹩. These experiments quantitatively demonstrate that age-predictive information is present in the environment surrounding clusters.
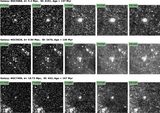
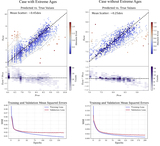
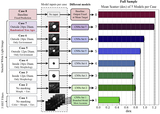
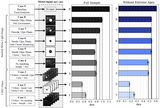
Other Images in This Article
Copyright and Terms & Conditions
© 2026. The Author(s). Published by the American Astronomical Society.