Image Details
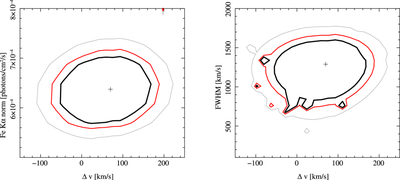
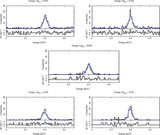
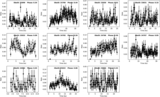
Caption: Figure 4.
Left: contour plots of the flux of the Fe Kα1 line versus the velocity of the line in km s–1 where the Compton shoulder is fit with a step function. Right: FWHM of the Fe Kα1 line versus the velocity of the line in km s–1. Note that the centroid and the width of the Fe Kα2 line are tied to the Fe Kα1 line as described in L. Barragán et al. (2009).
Other Images in This Article
Copyright and Terms & Conditions
© 2026. The Author(s). Published by the American Astronomical Society.
Copyright ©
2026 Astronomy Image Explorer. All Rights Reserved.