Image Details
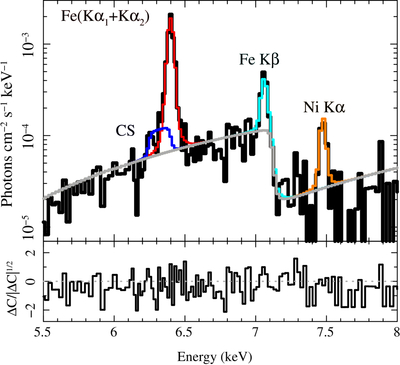
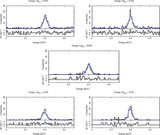
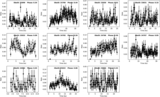
Caption: Figure 2.
Zoomed-in first-order HETG unfolded spectra showing the major components of the model. The Compton shoulder (CS) is shown in blue, the Fe Kα line in red, the Fe Kβ line in cyan, and the Ni Kα line in orange. The continuum is marked in gray.
Other Images in This Article
Copyright and Terms & Conditions
© 2026. The Author(s). Published by the American Astronomical Society.
Copyright ©
2026 Astronomy Image Explorer. All Rights Reserved.